
Index
Product Design
2023
Reducing Churn from 43% to 9%
How we tackle a chalenge with a lot of data analysis and stakeholder management


Context

Marvin, a B2B Payment Startup, uses credit card receivables “as coin”. We operate between the SMBs and their Suppliers, allowing the supplier to reduce the Non-payment rates and allowing the SMBs to have access to more credit and cash flow.
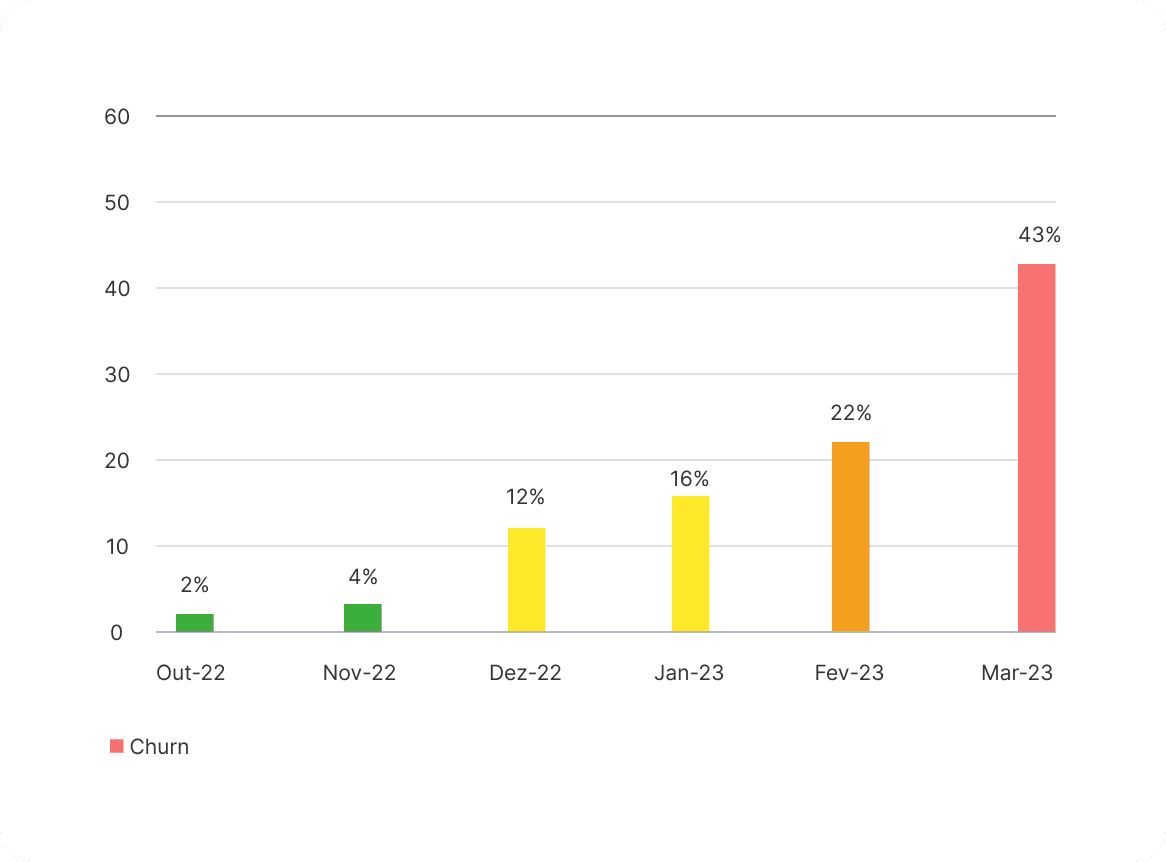
In February 2023, our BI team predicted a churn would occur by 43% of our customer's active base in March.
How could we be in 43%? Is this number trustworthy?
Why is this happening?
What does this churn mean?
How are we handling the churn currently?
What is considered churn?
Team

Data Analyst

CX Analyst

Product Manager

CRM Analyst

Product Designer
Roadmap
Research
Team
CX / CS
Data - PD
PD - CRM
Ideate
Ideate
Design
Design
Mar
Apr
May
Feb
Deliver
Ideate
Deliver
Deliver
Research
Research in our database
Research in our database


Talk to Sales team;
Research in our Customer Service history;
We deepdive into:
816 different companies
3 Business' Segment
What do we discover?
Research
Founds
0
10
20
30
40
50
60
Out-22
Nov-22
Dez-22
Jan-23
Fev-23
Mar-23
2%
4%
12%
16%
22%
43%
Churn
43% were very trustworthy!
But, what about the root causes?
Research
Understanding the problem

Miscommunication between the client and us:

Missing the target audience

Missing the payment behavior of our users
Research
Understanding the problem
Miscommunication between the client and us:
0
10
20
30
40
50
60
Oct-22
Nov-22
Dec-22
Jan-23
Feb-23
Mar-23
Apr-23
2%
4%
12%
16%
22%
43%
campaign
starts
campaign
finish
Churn
All new users acquired by this campaign have become a churn in march, and so on.
How it was designed
Supplier
Pilot Campain with our client
The supplier sends a list of user
so the OpsTeam could create the payments
Every month the supplier sends the list
Create the payment
Payment executed automactcally
Operation
Team
Payer
How it actually performs
Pilot Campain with our client
The supplier sends a list of user
so the OpsTeam could create the payments
Supplier forgot the list
user don’t pay the supplier using Marvin.
The supplier think Marvin doesn’t work
Supplier churn
Don’t create any payment
User churn
Operation
Team
Payer
Supplier
0
10
20
30
40
50
60
Oct-22
Nov-22
Dec-22
Jan-23
Feb-23
Mar-23
Apr-23
2%
4%
12%
16%
22%
43%
campaign
starts
campaign
finish
Churn
All new users acquired by this campaign have become a churn in march, and so on.
the result
If we persisted in this acquisition strategy:

We would have to deal with a 312% churn increase by June.
Research
Understanding the problem
Missing the target audience
Missing the target audience
Short term goal

Increase the active base numbers
Increase the active base numbers

We brought users who didn’t see value in our product, and it would affect our scalability and growth in the mid-long term.
We brought users who didn’t see value in our product, and it would affect our scalability and growth in the mid-long term.
Main reasons for churn :
Cost Plus campaign
PSG
Failure
No receivable
Reconciliation problem
Does not want to change the cash flow
No interest in the product
Product difficult to use
Business closed
Short term goal
Increase the active base numbers

We brought users who didn’t see value in our product, and it would affect our scalability and growth in the mid-long term.
Research
Understanding the problem
Missing the payment behavior of our users
Missing the payment behavior of our users
What is being considered a churn?
90
Days with no payment

SaaS

Franchising

On Trade
Different behavior
Different churn
It doesn’t represent real user behavior
What is being considered a churn?
90
Days with no payment
Approach
Short term
Addres the churn of March
Mid-Long term
create a scalable solution, and review the churn concept
Short term
Addres the churn of March
Mid-Long term
create a scalable solution, and review the churn concept


workshop - Churn Mapping

Segment
Supplier / number of uers
sample
bolean= receivables agenda
churn reason
CX analysis
Churn category matrix
Approach
Mid-Long term
create a scalable solution, and review the churn concept
We create a churn matrix to help the CX team fastly understand the nature of a particular churn
Churn Matrix
avoidable
voluntary
predictable
reversible
irreversible
unpredictable
involuntary
unavoidable
Avoidability
Willingness
Previsibility
Reversibility
Approach

Franchising - payment is every 15 days
payment is every 15 days
frequency = 1 (1 payment - 15 days)
behavior change - range of 22 days
frequency = 0.5
user doesn’t make any payment within 30 days
frequency = 0
No risk of Churn
FF = 1 and > 1
Moderate risk of churn
FF = 0.5
Higher risk of Churn
FF = 0 and < 0
Mid-Long term
create a scalable solution, and review the churn concept
We designed a retention operation based on the churn frequency rate.

We designed an automation flow for email marketing

We designed a churn monitoring panel.

Results
We work for 3 months, and we achieve:
We could stabilize our churn rate between 9%;
We change the whole culture around our customers, and refine our target segment, which in turn enables us to waver in our business strategy;
We improve our CX/CS strategy, becoming more agile and fast response;
Thanks so much for taking the time to read my work! I really appreciate it!
If you're intrigued and want to dive deeper, feel free to reach out; I'd love to chat!


Sorry for the view…
My portfolio is currently being updated to ensure proper responsiveness on mobile screens. For now, it is only accessible on desktop screens.